After running a Speed Event Management Report, each event will contain the following information:
| Device |
...
| Shows the device that generated the speed event. This will be either an IVU, Qube or iFace screen |
...
| Vehicle |
...
| Indicates the vehicle that the aforementioned device is assigned to in NextGen |
...
| Fleet |
...
| Fleet that the vehicle is a member of |
...
| Driver |
...
| If you have driver login enabled and your driver was logged in at the time of the incident, then their name will be displayed in this column |
...
| Branch | Branch |
...
| that the driver is a member of |
...
| Start Location |
...
| Location of the Speed Event | |
| Start |
...
| Time at which the speed event started | |
| End |
...
| Time at which the speed event finished | |
| Threshold Type |
...
This refers to which type of speed event has been triggered:
| |
| Speed Limit (km/h) |
...
| The limit that was breached | |
| Max Speed (km/h) |
...
| The highest actual speed that was recorded for this particular event | |
| Duration (h:m:s) |
...
| The length of the |
...
| event |
| End Type |
...
The reason why the event ended.
| |
| View Event |
...
Click on the eye |
...
|

After clicking on the View Event Eyeye, you will see the location of the event on a map.
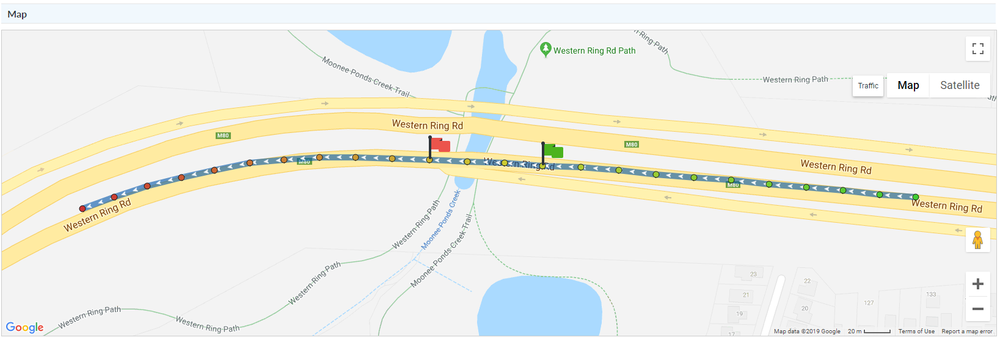
Green = Start of the trip | Orange = Middle of the trip | Red = End of the trip
| Expand | ||
|---|---|---|
| ||
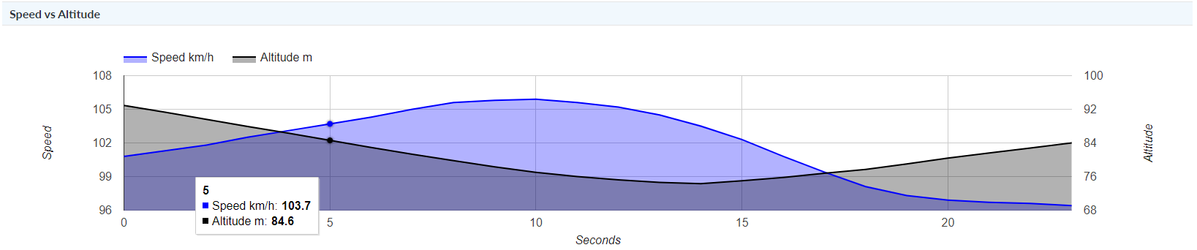
Below the map, you will see a speed vs altitude chart. This is particularly useful in understanding the driver's behaviour. Most of the time you will see the altitude decrease as the speed increases, indicating that the vehicle was speeding up as it came off a hill.
|
...