Data fields
...
After clicking on the View Event icon you will see the location of the event on a map.
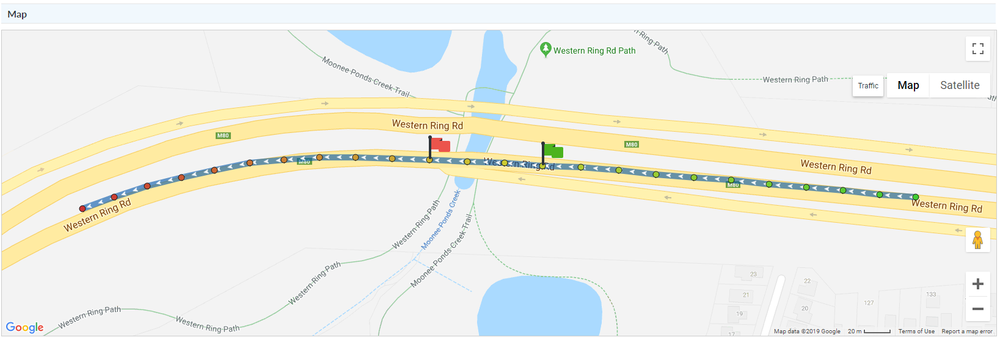
Green = Start of the trip | Orange = Middle of the trip | Red = End of the trip
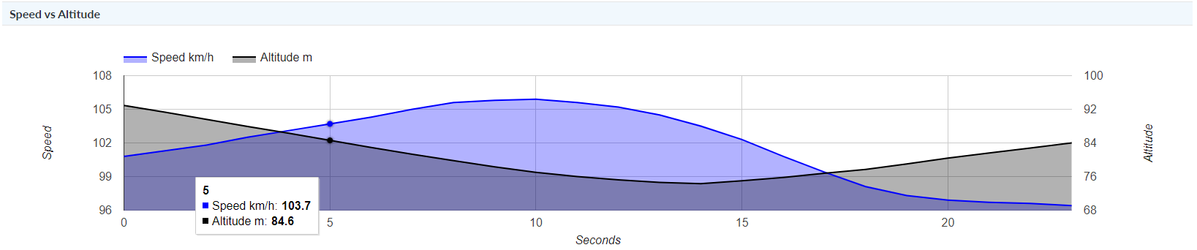
Speed graph
| Expand | ||
|---|---|---|
| ||
Below the map, you will see a speed vs altitude chart. This is particularly useful in understanding the driver's behaviour. Most of the time you will see the altitude decrease as the speed increases, indicating that the vehicle was speeding up as it came off a hill.
|
...
A valid speed event is typically indicated by a high number of satellites (74+) in the NSAT column, and a low number (<1<4.50) in the HDOP column.
Related articles
...