When viewing detailed results of the Speed Event Management Report
Step-by-Step guide
STEP 1:
When you have opened up the detailed view of a Speed Event from the report results (or have been linked to one via an alert), the first information you will see will be the following;
Device: Shows the device which generated the speed event. This will be either an IVU or an iFace screen. If your vehicle is fitted with an IVU, the speed event will most likely be generated from that unit.
Vehicle: Indicates the vehicle that the aforementioned device is assigned to in NextGen.
Fleet: Fleet that the vehicle is a member of.
User: If you have driver login enabled and your driver was logged in at the time of the incident then their name will be displayed in this column.
Location: Location of the Speed Event
Start: Time at which the speed event started
End: Time at which the speed event finished
Details:
- Duration of the speed event
- Maximum speed reached
- Speed limit
- Offset (speed over the limit at which the speed event is triggered)
- Threshold type
- Threshold duration
- End type
STEP 2:
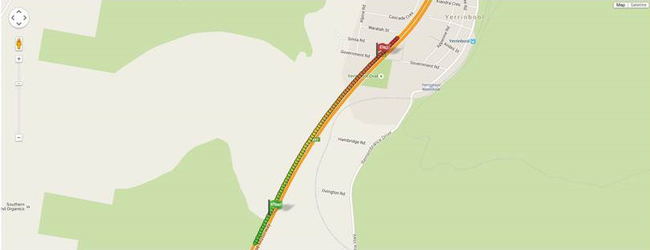
The map indicates where the speed event took place. Green indicates the beginning of the speed event and red the end.
STEP 3:
Below the map, you will see a speed vs altitude chart. This is particularly useful in understanding the driver behaviour. Most of the time you will see the altitude decrease as the speed increases, indicating the vehicle was speeding up as it came off a hill.
STEP 4:
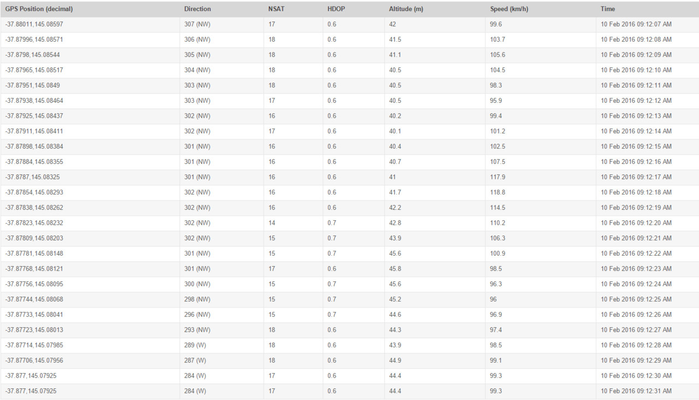
NextGen also displays second by second speed information underneath the speed vs altitude chart. This gives you a clear view of the rate at which the speed increased as well as valuable information regarding the quality of GPS signal during the speed event. If the GPS signal is less than ideal during the event, this brings the validity of the event into question.
The above second by second data indicates a perfectly valid speed event - the NSAT (Number of Satellites 7+) is high, and the HDOP is consistently low (<1.5)
Related articles


