/
Sentinel Activity Chart
Sentinel Activity Chart
- Jonathan Gruber (Unlicensed)
- Lincoln McGregor-Smith (Unlicensed)
- Tyson Dorsett
Owned by Jonathan Gruber (Unlicensed)
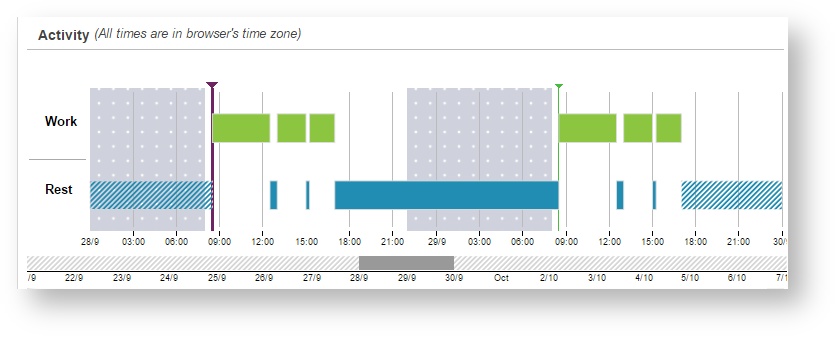
How to identify the information shown on the Sentinel 4 Activity Chart
| Event Type | Description | Displayed as | |||||||
|---|---|---|---|---|---|---|---|---|---|
Work Period | Periods of work are shown in green. To view the details of a period of work, hover over it and you will be shown the total duration as well as the Start and Stop times and event types. | 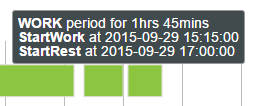 | |||||||
| Rest Period | Periods of rest are shown in blue. To view the details of a period of rest, hover over it and you will be shown the total duration as well as the Start and Stop times and event types. | 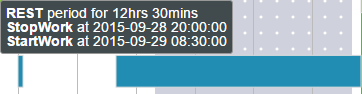 | |||||||
| Night Rest | Rest taken between the hours of 10pm and 8am is considered to be Night Rest. Where a rest break is taken during these hours, this will be shown in the activity chart in the form of a grey background with white dots. Hover over the grey area to view details of the Night Rest. | 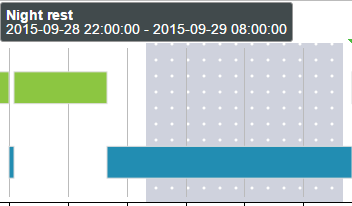 | |||||||
| Lead in / Lead out | If you are viewing a 24 hour period starting at 00:00 and the drivers status was last change during the previous day, the current state will be displayed in the appropriate colour, but will be streaked with diagonal lines. This identifies a lead-in. The same applies if the driver's state at the end of the period you are viewing continues past the end of the viewed period. This is known as a lead-out. Whether resting or working, the time of the event which put the driver into that state can be determined by hovering over the streaked area. | 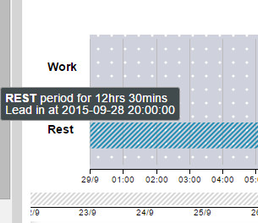 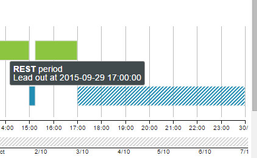 | |||||||
| 7 hour break | A rest break of 7 hours or more is considered a major rest break and is used to calculate the drivers available hours during the 24 hour period immediately following the major rest break. The end of a 7 hour rest break is shown in the Sentinel 4 Activity Chart as a bright green line with an arrow on top. | 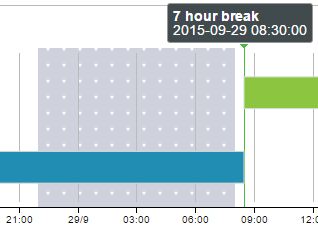 | |||||||
| 24 hour break | A rest break at least 24 hours is considered a major rest break and is used to calculate the drivers available hours during the longer running fatigue rules. The end of a 24 hour rest break is shown in the Sentinel 4 Activity Chart as a bold purple line line with an arrow on top. | 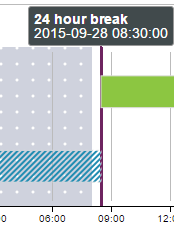 | |||||||
| Predicted Violation | Predicted violations are shaded in yellow. They indicate which violations will occur if the driver stays in their current status without resting. The darker the shade of yellow, the more rules will have been breached. | 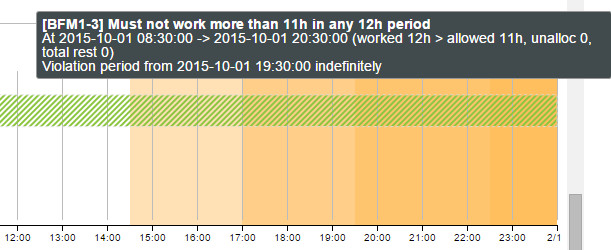 | |||||||
| Actual Violation | Violations are shaded in red. They indicate which violations have occurred. The darker the shade of red, the more rules have been breached. | 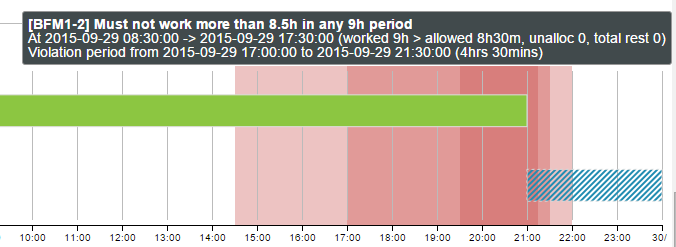 | |||||||

Related articles
| Event Type | Description | Displayed As |
Related content
Sentinel Kiosk
Sentinel Kiosk
More like this
Sentinel 4 App - OLD UI
Sentinel 4 App - OLD UI
Read with this
Sentinel
More like this
Sentinel NZ user guide
Sentinel NZ user guide
Read with this
Sentinel/EWD FAQs
Sentinel/EWD FAQs
More like this
Sentinel for Allocators, Accounts & Payroll
Sentinel for Allocators, Accounts & Payroll
More like this